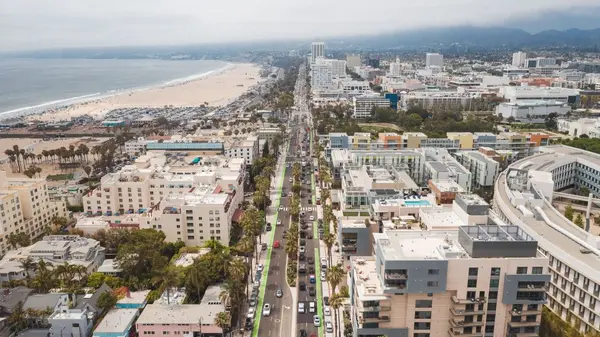
LA Real Estate Isn’t Slowing — It’s Separating Strategy from Speculation

LA Real Estate Isn’t Slowing — It’s Separating Strategy from Speculation
The State of the Los Angeles Real Estate Market — and Strategic Expansion in 2026
Los Angeles real estate is no longer a momentum trade driven by ultra-low rates and compressed inventory. In 2026, it has become something more deliberate: a capital allocation decision.
After years of historically inexpensive borrowing and intense competition for limited supply, today’s underwriting environment looks different. Mortgage rates remain elevated relative to the prior cycle. Insurance premiums have risen across many submarkets, particularly in hillside and fire-adjacent areas. Regulatory frameworks at both the city and county level continue to evolve, shaping how rental property is evaluated and managed. None of these shifts eliminate opportunity — but they do require sharper analysis and more disciplined execution.
And yet, despite these pressures, Los Angeles remains one of the most supply-constrained and globally desirable real estate markets in the country. The long-term fundamentals that have supported property values here — limited housing production, employment concentration across entertainment, technology, and international trade, global capital participation, and enduring lifestyle demand — remain firmly intact. This is not a market in retreat. It is a market recalibrating.
What’s Happening Inside Los Angeles County
Inventory has improved modestly compared to the peak scarcity years of 2021 and 2022, giving buyers more time to evaluate and negotiate. However, well-positioned properties in strong micro-markets continue to transact decisively. In this environment, pricing discipline matters more than ever. Overpricing is punished quickly; properly positioned assets still attract serious interest.
Los Angeles continues to operate as an appreciation-forward market. Investors rarely enter expecting high initial cash yields. Instead, the thesis has historically centered on long-term equity growth supported by structural undersupply.
Within the county, performance varies significantly by neighborhood.
Lifestyle-driven corridors such as Silver Lake, Los Feliz, Highland Park, and West Adams continue to benefit from walkability, architectural character, and proximity to employment centers. Coastal submarkets like Santa Monica, Manhattan Beach, and Playa Vista remain higher-entry capital preservation plays with historically stronger downside resilience. Meanwhile, neighborhoods such as Glassell Park, El Sereno, and North Hollywood offer comparatively more accessible pricing while benefiting from spillover demand and ongoing improvement cycles.
In 2026, micro-location carries more weight than macro headlines. Two properties a mile apart can perform very differently depending on zoning exposure, insurance classification, and buyer profile.
The Financial Variables Shaping This Cycle
Today’s buyers are modeling more variables than they did three years ago. Interest rate sensitivity, insurance volatility, property tax projections, rent control exposure, and cap rate compression are now standard components of underwriting. This increased scrutiny is not a weakness in the market — it is a sign of maturity.
Los Angeles remains resilient, but it is no longer forgiving of loose assumptions.
Buying in Los Angeles — and Expanding Beyond It
For many investors, Los Angeles remains the portfolio anchor. But for others, the conversation has expanded beyond a single geography.
The question I hear more frequently in 2026 is not “Should I leave California?” It is “How do I balance long-term appreciation with predictable monthly income?”
That shift has led some investors to evaluate markets where acquisition costs are lower relative to rents. Cities frequently discussed in income-focused strategy conversations include Indianapolis, Indiana; Huntsville, Alabama; and Kansas City, Missouri. These metros often present stronger rent-to-price ratios on paper when compared with coastal California.
However, median pricing alone does not tell the full story.
In many of these markets, entry-level budgets in the $150,000 to $300,000 range may secure a single-family rental in a stable but not premium neighborhood, or a value-add duplex requiring renovation capital. Stabilized small multifamily properties in desirable submarkets can command premiums due to investor competition. Gross yield projections must be balanced against management costs, vacancy assumptions, capital expenditure reserves, and neighborhood-level demand trends.
Higher theoretical yields do not eliminate execution risk. Underwriting discipline remains essential regardless of geography.

What About Staying Within Driving Distance?
A common question I hear is whether similar income opportunities exist within two to three hours of Los Angeles.
The honest answer is: not in the way many investors hope.
Southern California’s pricing gravity extends well beyond county lines. Markets in the Inland Empire and parts of the Central Valley — including cities like Riverside, San Bernardino, Bakersfield, and Fresno — can offer stronger rent-to-price ratios than coastal Los Angeles. When priced correctly and managed well, these markets can complement a Los Angeles-centered portfolio. Entry prices are lower, and single-family rentals in particular may pencil more favorably on paper.
However, those opportunities come with tradeoffs. Economic concentration, vacancy sensitivity during downturn cycles, insurance variables, and neighborhood-level volatility must be factored into underwriting. Higher theoretical yield within driving distance often corresponds with higher cyclicality.
In other words, there is rarely hidden yield market just outside Los Angeles that offers high cash flow with coastal-level stability. Investors who want materially stronger income profiles typically need to expand their geographic lens further.
The decision is not about proximity. It is about risk alignment.
A Portfolio Allocation Framework
Rather than framing the decision as Los Angeles versus the Midwest, a more sophisticated approach is to define the role each asset plays within a broader portfolio.
Los Angeles may serve as a long-term equity anchor supported by supply constraints and global demand. Select Midwest or Southeast markets may serve as income stabilizers with lower entry points and different regulatory structures. Each geography carries its own liquidity profile, management considerations, and economic drivers.
Diversification is not abandonment. It is risk management.
Fatima’s Take
Capital is not fleeing Los Angeles. It is becoming more intentional.
In a higher-rate, higher-cost environment, the most disciplined investors are stress-testing assumptions, modeling downside scenarios, and building portfolios that can perform across cycles. Los Angeles continues to offer strong long-term fundamentals, but concentration risk exists in any single market.
The real question in 2026 is not “Where is the hottest market?”
It is “What allocation strategy aligns with my balance sheet, risk tolerance, and long-term objectives?”
Momentum built wealth in the last cycle. Strategy will define this one.
For many Los Angeles property owners, 2026 is less about chasing the next acquisition and more about evaluating whether their current asset still fits their long-term strategy. If you’re considering selling — whether to reposition within LA or redeploy capital elsewhere — this is the kind of market that rewards preparation, pricing discipline, and thoughtful positioning. Strategic exits often matter just as much as strategic entries.
Sources
The following publicly available data and reports were referenced in preparing this market overview. All figures reflect information available as of March 2026 and may vary by submarket, property type, and financing structure.
Housing Values & Market Trends
- Zillow Home Value Index (ZHVI) — Los Angeles County, CA; Indianapolis, IN; Huntsville, AL; Kansas City, MO
- Redfin Data Center — Median Sale Price, Inventory Levels, Days on Market
- Realtor.com Market Trends Reports (2025–2026)
Rental Market Data
- RentCafe Market Reports (Los Angeles, Indianapolis, Huntsville, Kansas City)
- Apartment List National Rent Report
- Zillow Observed Rent Index (ZORI)
Mortgage & Interest Rate Environment
- Freddie Mac Primary Mortgage Market Survey (PMMS)
- Federal Reserve Economic Data (FRED) — 30-Year Fixed Mortgage Average
Employment & Economic Context
- U.S. Bureau of Labor Statistics (BLS) — Local Area Unemployment Statistics
- U.S. Census Bureau — Population & Housing Estimates
- Bureau of Economic Analysis (BEA) — Regional GDP Data
Insurance & Regulatory Context (California)
- California Department of Insurance — Market Bulletins & Rate Filings
- Los Angeles Housing Department (LAHD) — Rent Stabilization Ordinance (RSO) Updates
- California Department of Housing & Community Development (HCD)
Yield & Investor Benchmark Context
- Public investor reports and brokerage research comparing gross rental yield ranges across major U.S. metropolitan areas (2025–2026).
Disclaimer: This article is for informational purposes only and does not constitute investment, tax, or legal advice. Market conditions and returns vary based on asset type, financing structure, and neighborhood-specific factors.
Categories
Recent Posts